OWS Styling HOW-TO Guide: Legends
Legends
Many visualisation styles require a legend to be properly understood. Datacube-OWS provides support for auto-generation of legends that cover many common use cases. For specialised use cases not covered by OWS automatic legends, you can provide OWS with manually (or at least externally) created legend image.
Auto-legend-generation for Colour Ramp Styles
The first type of style that supports automatic legend-generation is colour ramp styles.
For these examples, we will use a simple colour ramp style using a Matplotlib named colour ramp:
# Create a style definition with a legend section:

style_with_default_legend = {
    "index_function": {
        "function": "datacube_ows.band_utils.norm_diff",
        "kwargs": {"band1": "nir", "band2": "red"},
    },
    "mpl_ramp": "RdYlGn",
    "range": [-1.0, 1.0],
    "legend": {
        # The discussion in this chapter will focus on what goes here.
    }
}

# Generate and save a legend image:

from datacube_ows.styles.api import generate_ows_legend_style_cfg

# Note this command will also display the legend in a JupyterHub/notebook-type environment)
image = generate_ows_legend_style_cfg(cfg)

# Write out as PNG:
with open("filename.png", "wb") as fp:
    image.save(fp)
Default colour-ramp legend
Let’s start with default legend, with the “legend” section left empty or missing all together:
"legend": {}
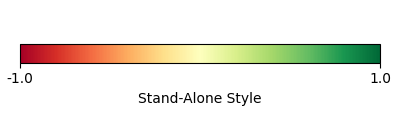
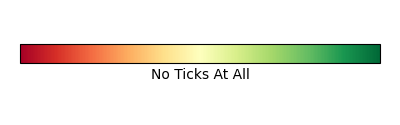
By default, the legend strip runs across the full value range of the ramp, and only has “ticks” for minimum and maximum values with none in between.
For custom ramps, the legend strip runs from first non-transparent value to the last non-transparent value. For example, an NDVI custom ramp that was transparent for negative values would run from 0.0 to 1.0 by default.
Legend title
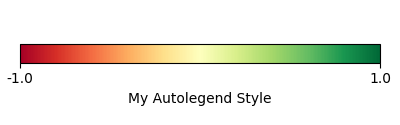
The “Stand-Alone Style” title comes from this being a standalone style within the API. Real OWS styles must have a unique title that would normally go here. E.g.
style_with_default_legend_and_title = {
    "title": "My Autolegend Style",
    "index_function": {
        "function": "datacube_ows.band_utils.norm_diff",
        "kwargs": {"band1": "nir", "band2": "red"},
    },
    "mpl_ramp": "RdYlGn",
    "range": [-1.0, 1.0],
    "legend": {
    }
}
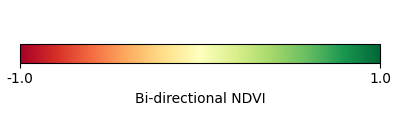
You can also set a title for the legend separate to the style title. E.g.
"legend": {
    "title": "Bi-directional NDVI",
}
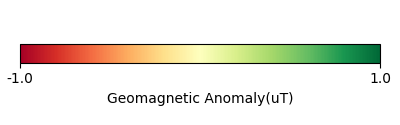
You can also specify units, which are added in parentheses after the title:
"legend": {
    "title": "Geomagnetic Anomaly",
    "units": "uT",
}
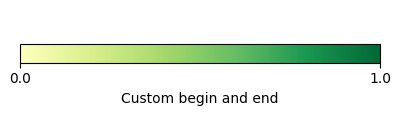
Setting legend range
The start and end of the legend strip can be over-ridden with the “begin” and “end” elements. These elements can be integers, floats or numeric strings - however floats are strongly discouraged as they can result in unexpected behaviour. For more information refer to Floating Point Arithmetic: Issues and Limitations in the official Python tutorial.
E.g.
"legend": {
    "title": "Custom begin and end",
    "begin": "0.0",
    "end": "1.0",
}
Legend Ticks
Additional ticks can be added in three ways:
Regularly spaced ticks by spacing (
ticks_every)Regularly spaced ticks by count (
tick_count)Explicit ticks (
ticks)
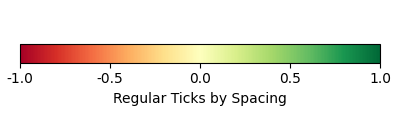
Regularly spaced ticks by spacing (ticks_every)
This example has ticks every 0.5, from -1.0 to 1.0. (Again, avoid using raw floats)
"legend": {
    "title": "Regular Ticks By Spacing",
    "begin": "-1.0",
    "end": "1.0",
    "ticks_every": "0.5",
}
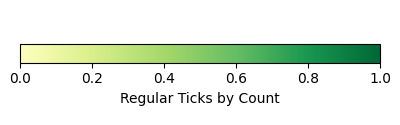
Regularly spaced ticks by count (tick_count)
This example has 5 regular spaced ticks, from 0.0 to 1.0.
"legend": {
    "title": "Regular Ticks By Count",
    "begin": "0.0",    # avoid floats, but
    "end": "1.0",
    "ticks_count": 5,  # integers are ok
}
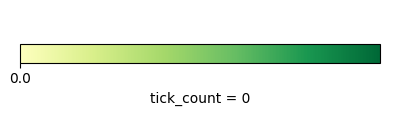
Note that first tick is not counted in the tick count: setting tick_count to zero results in a single
tick at the start of the legend bar and setting tick_count to 1 is the same as the default.

Explicit ticks
Tick locations can also be specified explicitly by setting ticks to a list of values. Again, please
use numeric strings rather than floats.
The following examples cover some interesting cases that are not possible using
either tick_count or ticks_every:
"legend": {
    "title": "No Ticks At All",
    "begin": "-1.0",
    "end": "1.0",
    "ticks": []
}
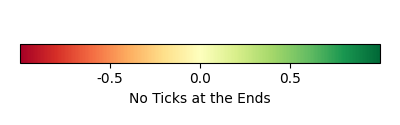
"legend": {
        "title": "No Ticks at the Ends",
        "begin": "-1.0",
        "end": "1.0",
        "ticks": ["-0.5", "0.0", "0.5"],
    }
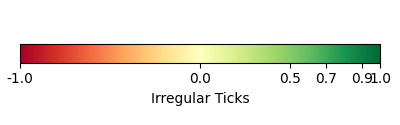
"legend": {
    "title": "Irregular Ticks",
    "begin": "-1.0",
    "end": "1.0",
    "ticks": ["-1.0", "0.0", "0.5", "0.7", "0.9", "1.0"],
}
You can cannot combine ticks, ticks_every, or tick_count. Not using any is equivalent to:
"tick_count": 1,
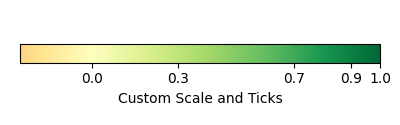
For full control over legend range and tick positions, use explicit “ticks” - and set begin and end manually.
"legend": {
    "title": "Custom Scale and Ticks",
    "begin": "-0.1",
    "end": "1.0",
    "ticks": ["0.0", "0.3", "0.7", "0.9", "1.0"],
}
Tick labels
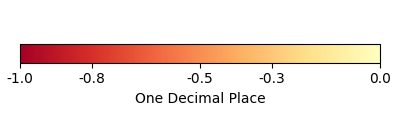
decimal_places
By default, tick labels are displayed to one decimal place:
"legend": {
    "title": "One Decimal Place",
    "begin": "-1",
    "end": "0",
    "tick_count": 4,
}
In this case, we really wanted two decimal places:
"legend": {
    "title": "Two Decimal Places",
    "begin": "-1",
    "end": "0",
    "decimal_places": 2,
    "tick_count": 4,
}

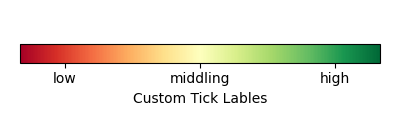
Prefixes and Suffixes and Custom Labels
Or you can override the label for each tick individually using a tick_labels dictionary. Note that the keys
must exactly match the non-overridden labels as they were calculated. If you experience problems,
an explicit ticks list will minimise confusion.
"legend": {
    "title": "Custom Tick Lables",
    "begin": "-1",
    "end": "1",
    "ticks": ["-0.75", "0.0", "0.75"],
    "tick_labels": {
        "-0.75": {"label": "low"},
        "0.0": {"label": "middling"},
        "0.75": {"label": "high"},
    }
}
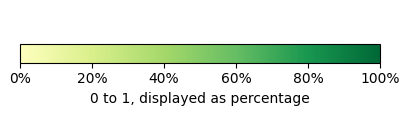
You can also specify prefixes and suffixes for tick labels, either individually or as defaults for all labels.
"legend": {
    "title": "0 to 1, displayed as percentage",
    "begin": "0.0",
    "end": "1.0",
    "ticks": ["0.0", "0.2", "0.4", "0.6", "0.8", "1.0"],
    "tick_labels": {
        "default": {
            "suffix": "%",
        },
        "0.0": {"label": "0"},
        "0.2": {"label": "20"},
        "0.4": {"label": "40"},
        "0.6": {"label": "60"},
        "0.8": {"label": "80"},
        "1.0": {"label": "100"},
    }
}
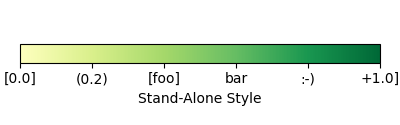
"legend": {
    "begin": "0.0",
    "end": "1.0",
    "ticks": ["0.0", "0.2", "0.4", "0.6", "0.8", "1.0"],
    "tick_labels": {
        # Surround every tick label in square brackets (unless over-ridden)
        "default": {
            "prefix": "[",
            "suffix": "]",
        },
        # There is no "0.0" entry, so the 0.0 tick will be labelled "[0.0]"
        # (according to the default rules)
        # ---------------------------------
        # The 0.2 tick will be labelled "(0.2)"
        "0.2": {
            "prefix": "(",
            "suffix": ")",
        },
        # ---------------------------------
        # The 0.4 tick will be labelled "[foo]"
        # (Note the default prefix and suffix are still applied)
        "0.4": {
            "label": "foo",
        },
        # ---------------------------------
        # The 0.6 tick will be labelled "bar" with no prefix or suffix
        "0.6": {
            "prefix": "",
            "label": "bar",
            "suffix": "",
        },
        # ---------------------------------
        # The 0.8 tick will be labelled ":-)"
        "0.8": {
            "prefix": ":",
            "label": "-",
            "suffix": ")",
        },
        # ---------------------------------
        # The 1.0 tick, will be labeled "+1.0]"
        # (prefix over-ridden, default suffix still applies)
        "1.0": {
            "prefix": "+",
        },
    }
}
Customising legend layout
Image Size
The width and height values are passed to matplotlib to specify the size of the generated image.
The image size defaults to 4 inches wide by 1.25 inches tall. The default dpi for MatPlotLib is 100, so this corresponds to 400x125 pixels (unless you have over-ridden the default dpi).
E.g.:
# A legend in need of more room
"legend": {
    "title": "Over Crowded Legend",
    "begin": "-1.0",
    "end": "1.0",
    "ticks_every": "0.1",
    "tick_labels": {
        "0.0": "This\nis\na\nvery\ntall\nlabel"
    }
}
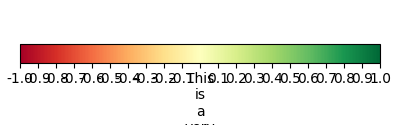
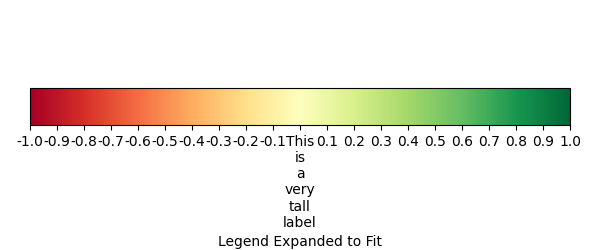
This legend image is too small to fit all the needed data legibly. This can be fixed by enlarging the image:
# Bigger legend image
"legend": {
    "title": "Over Crowded Legend",
    "begin": "-1.0",
    "end": "1.0",
    "ticks_every": "0.1",
    "tick_labels": {
        "0.0": "This\nis\na\nvery\ntall\nlabel"
    },
    "width": 6,    # 600 pixels at default dpi
    "height": 2.5, # 250 pixels at default dpi
}
Ramp Strip Location
The location of the coloured ramp strip within the legend image can be customised with the strip_location element.
This should be a tuple of four floats which is passed directly to the MatPlotLib Figure.add_axes function.
The four floats are expressed as fractions of the width or heigth (i.e. are numbers between 0.0 and 1.0). The values are interpreted as follows: [left, bottom, width, height].
The default value is [0.05, 0.5, 0.9, 0.15]
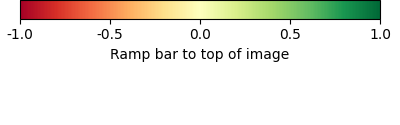
For example to move the bar towards the top of the image, raise the bottom:
"legend": {
    "title": "Ramp bar to top of image",
    "begin": "-1.0",
    "end": "1.0",
    "ticks_every": "0.5",
    "strip_location": [0.05, 0.85, 0.9, 0.15],
}
Auto-legend-generation for Colour Map Styles
Auto-generated legends are also available for colour map styles.
For these examples, we will be extending the following style example:
transparency_map_cfg = {
    "value_map": {
        "water": [
            {
                # Make noncontiguous and invalid data transparent
                "title": "",
                "flags": {
                    "or": {
                        "noncontiguous": True,
                        "nodata": True,
                    },
                },
                "alpha": 0.0,
                "color": "#ffffff",
            },
            {
                "title": "Cloudy Steep Terrain",
                "flags": {
                    "and": {
                        "high_slope": True,
                        "cloud": True
                    }
                },
                "color": "#f2dcb4",
            },
            {
                "title": "Cloudy Water",
                "flags": {
                    "and": {
                        "water_observed": True,
                        "cloud": True
                    }
                },
                "color": "#bad4f2",
            },
            {
                "title": "Shaded Water",
                "flags": {
                    "and": {
                        "water_observed": True,
                        "cloud_shadow": True
                    }
                },
                "color": "#335277",
            },
            {
                "title": "Cloud",
                "flags": {"cloud": True},
                "color": "#c2c1c0",
            },
            {
                "title": "Cloud Shadow",
                "flags": {"cloud_shadow": True},
                "color": "#4b4b37",
            },
            {
                "title": "Terrain Shadow or Low Sun Angle",
                "flags": {
                    "or": {
                        "terrain_shadow": True,
                        "low_solar_angle": True
                    },
                },
                "color": "#2f2922",
            },
            {
                "title": "Steep Terrain",
                "abstract": "",
                "flags": {"high_slope": True},
                "color": "#776857",
            },
            {
                "title": "Water",
                "abstract": "",
                "flags": {"water_observed": True},
                "color": "#4f81bd",
            },
            {
                "title": "Dry",
                "abstract": "",
                "flags": {"water_observed": False},
                "color": "#96966e",
            },
        ]
    },
    "legend": {
        # legend config goes here
    }
}
With the default legend settings, the resulting legend looks like this:
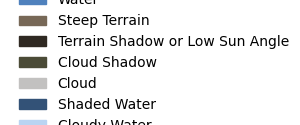
The first thing to note is that the resulting image is not big enough to contain all the possible values.
This can be addressed with the width and height entries, which work the same for color ramp
legends, as described above. The default width and height for colour map legends are 3 inches and 1.25 inches
respectively - which is slightly different to the default values for colour-ramp legends.
"legend": {
    "width": 3.0,
    "height": 2.0,
},
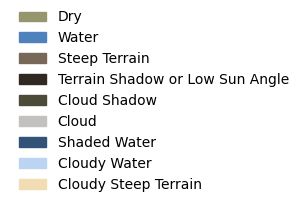
Note that a legend-patch is generated for all non-transparent value_map rules, using the title and/or abstract
defined in the value_map.